Key Highlights:
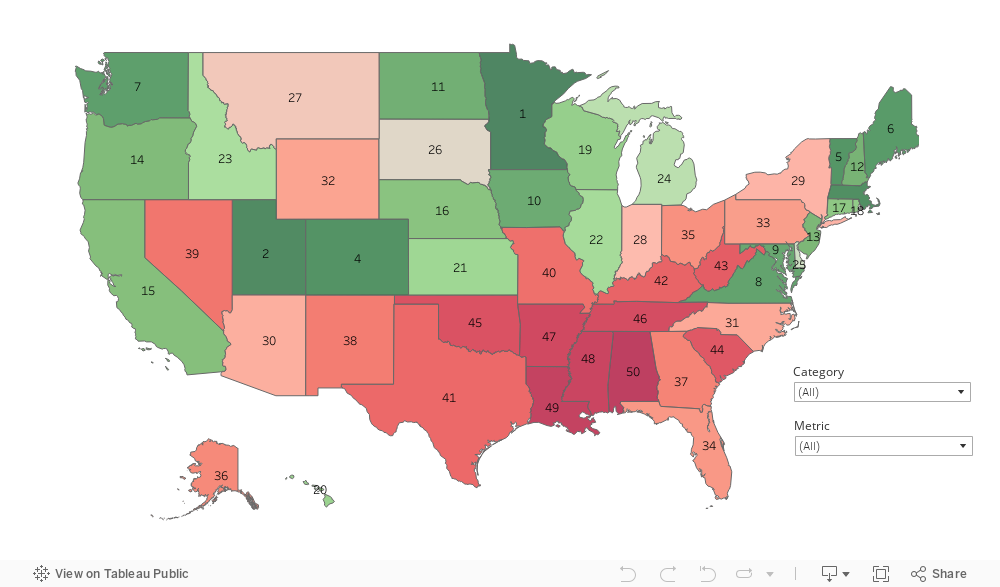
- Minnesota, Utah, and Massachusetts are the best states for millennials for the second time in a row.
- California used to be ranked #25, but this year it has risen to #15 as the best state.
- New York jumped from spot #41 to spot #29.
- This year, Alabama and Louisiana switched positions. Alabama used to rank #49, while Louisiana was at #50. However, this year, they reversed their positions, making Alabama the worst state for this generation.
Rankings of Best & Worst States for Millennials
In recent years, millennials, who were born between 1981 and 1996, have risen to prominence as the dominant generation in the United States. They are poised to take on leadership roles in the workforce, make significant economic contributions, and continue to shape politics and drive social change. Therefore, it’s crucial for millennials to reside in conducive environments as they pursue these goals.
The second edition of the Best and Worst States for Millennials, has compiled data from 52 metrics that impact this generation’s decision on where to live. Considerations such as the cost of living, homeownership rate, unemployment rate, and median student loan debt, amongst other factors. Scholaroo´s data team have compared all 50 states and ranked them from best to worst for millennials.
This unique report considers a depth of topics across 52 metrics in 7 key dimensions: Affordability, Political & Social Environment, Employment, Quality of Life, Health, Personal Finance, and Safety. Read on to find out which state is the best, and how other states ranked in comparison.
Category Breakdown

Methodology
In order to determine the best and worst states for millennials, Scholaroo compared the 50 states across seven key dimensions:
- Affordability
- Employment
- Health
- Personal Finance
- Political & Social Environment
- Quality of Life
- Safety
We evaluated those dimensions using 52 relevant metrics, which are listed below with their corresponding weight. Each metric was graded on a 100-point scale, with a score of 100 being the max.
Finally, we determined each state’s weighted average across all metrics to calculate its overall score and used the resulting scores to rank-order our sample.
Affordability (20 points)
Cost of Living: Triple Weight (6.67 points)
Note: Cost of living in the second quarter of 2023.
Gym Cost: Half Weight (1.11 points)
Note: Average monthly cost of a gym membership.
Homeownership Rate: Double Weight (4.44 points)
Note: Percentage of millennials who own homes in the national territory in 2023.
Beer Cost: Half Weight (1.11 points)
Note: Average price of a 24-pack of beer in 2023.
Health insurance Cost: Regular Weight (2.22 points)
Note: Average monthly cost of health insurance for millennials in 2023.
Accommodation Cost: Regular Weight (2.22 points)
Note: Average accommodation cost for 3 nights for one person.
Haircut Cost: Half Weight (1.11 points)
Note: Average haircut cost in 2023.
Manicure Cost: Half Weight (1.11 points)
Note: Average manicure cost.
Political & Social Environment (20 points)
Gender Pay Gap: Double Weight (3.81 points)
Note: Difference between median earnings for men and women who worked full time.
LGBTQ+ Friendliness Ranking: Regular Weight (1.90 points)
Note: Based on Outleadership’s State LGBTQ+ Business Climate Index 2023 (Legal and Nondiscrimination Protections, Youth and Family Support, Political and Religious Attitudes, Health Access and Safety, Work Environment and Employment).
Climate Change Ranking: Double Weight (3.81 points)
Note: Based on Wise Voter’s Best & Worst States for Climate Change.
Volunteering Rate: Regular Weight (1.90 points)
Note: Rate of volunteers in 2022.
Racial Disparity Ranking: Double Weight (3.81 points)
Note: Based on Scorecard’s Racial Disparity rank on the gap in outcomes between white residents and residents of color that result from economic exclusion and structural inequity.
Gender Equality: Double Weight (3.81 points)
Note: Based on Wise Voter’s Best & Worst States for Women.
Right to Protest Rating: Half Weight (0.95 points)
Note: Number of enacted laws that restrict the right to peaceful assembly.
Employment (15 points)
Unemployment Rate: Double Weight (3.00 points)
Note: Percentage of millennials who are unemployed.
Average Income: Triple Weight (4.50 points)
Note: Average yearly income of millennials in 2023.
Right to work: Regular Weight (1.50 points)
Note: States with a Right to Work Law.
Rate of New Entrepreneurs: Regular Weight (1.50 points)
Note: Rate of new entrepreneurs in 2021.
Labor Force Participation Rate: Regular Weight (1.50 points)
Note: Labor force participation rate in 2023.
Job Growth Rate: Double Weight (3.00 points)
Note: States with the highest Job growth in the last 10 years.
Quality of Life (15 points)
Share of Millennials: Double Weight (3.16 points)
Note: Percentage of adults between 25 and 40 years old.
Share of Movie Theaters: Regular Weight (1.58 points)
Note: Number of movie theaters, per size of state.
Bicycle Friendly Rank: Regular Weight (1.58 points)
Note: Bicycle Friendly State Bike League ranking based on Bicycle Friendly Actions, Infrastructure & Funding, Education & Encouragement, Traffic Laws & Practices, Policies & Programs, and Evaluation & Planning.
Commuting Time: Regular Weight (1.58 points)
Note: Average amount of time spent commuting to work.
Share of Bars: Regular Weight (1.58 points)
Note: Number of bars, per 100K.
Kid-Friendly Neighborhood: Half Weight (0.79 points)
Note: Percentage of neighborhoods in each state reported to the NSCH as having each of four different kid-friendly amenities (parks, recreation centers, sidewalks, or libraries).
Pollution Rate: Regular Weight (1.58 points)
Note: Average exposure of the general public to particulate matter of 2.5 microns or less measured in micrograms per cubic meter.
Non-Smoking Regulation: Regular Weight (1.58 points)
Note: Percentage of population covered by 100% smoke-free laws for restaurants, bars, and non-hospitality workplaces.
Retirement Age: Regular Weight (1.58 points)
Note: Average retirement age.
Health (15 points)
Diagnosed Depression Rate: Regular Weight (1.20 points)
Note: Percentage of adults 18 to 44 who reported being told by a health professional that they have a depressive disorder.
Uninsured Rate: Double Weight (2.40 points)
Note: Percentage of the population not covered by private or public health insurance.
Suicide Rate: Regular Weight (1.20 points)
Note: Percentage of millennials that have committed suicide in the last year.
Obesity Rate: Regular Weight (1.20 points)
Note: Percentage of adults 18 to 44 with a body mass index of 30.0 or higher based on reported height and weight.
Physical Inactivity Rate: Regular Weight (1.20 points)
Note: Percentage of adults 18 to 44 who reported doing no physical activity or exercise other than their regular job in the last 30 days.
Dental Visit Rate: Regular Weight (1.20 points)
Note: Percentage of adults 18 to 44 who reported visiting the dentist or dental clinic within the past year.
Exercise Rate: Regular Weight (1.20 points)
Note: Percentage of adults 18 to 44 who met the federal physical activity guidelines (150 minutes of moderate or 75 minutes of vigorous aerobic activity and two days of muscle strengthening per week).
Smoking Rate: Regular Weight (1.20 points)
Note: Percentage of adults 18 to 44 who reported smoking at least 100 cigarettes in their lifetime and currently smoke daily or some days.
Drinking Rate: Regular Weight (1.20 points)
Note: Percentage of adults 18 to 44 who reported binge drinking (four or more [females] or five or more [males] drinks on one occasion in the past 30 days) or heavy drinking (eight or more [females] or 15 or more [males] drinks per week).
Non-medical Drug Use Rate: Half Weight (0.60 points)
Note: Percentage of adults who reported using prescription drugs non-medically or illicit drugs in the last 12 months.
Mental Distress Rate: Double Weight (2.40 points)
Note: Percentage of adults 18 to 44 who reported their mental health was not good for 14 or more days in the past 30 days.
Personal Finance (10 points)
Median Student-Loan Debt: Double Weight (2.67 points)
Note: Average student loan debt owned by millennials in 2023.
Credit Utilization Rate: Regular Weight (1.33 points)
Note: Total average millennial credit utilization rate.
Average FICO Scores: Double Weight (2.67 points)
Note: Average FICO Scores based on Payment history (35%), Amounts owed (30%), Length of credit history (15%), New Credit (10%), and Credit mix (10%).
Average Number of Credit Cards: Half Weight (0.67 points)
Note: Millennial average number of credit cards.
Retirement Plan Access: Regular Weight (1.33 points)
Note: Adults 30 to 44 who have access to an employer-based retirement plan.
Retirement Plan Participation: Regular Weight (1.33 points)
Note: Adults 30 to 44 who participate in an employer-based participation plan.
Safety (5 points)
Sexual Harassment Rate: Regular Weight (1.00 point)
Note: Rate of millennials that have been sexually harassed within the state.
Robbery Rate: Regular Weight (1.00 point)
Note: Rate of millennials that have been robbed within the state.
Murder Rate: Regular Weight (1.00 point)
Note: Rate of millennials that have been murdered within the state.
Police Officers Rate: Regular Weight (1.00 point)
Note: Law enforcement officers per population.
Aggravated Assault: Regular Weight (1.00 point)
Note: Rate of millennials that have been victims of aggravated assault within the state.