Best states for teachers 2023

When it comes to finding the best states for teachers and educators, there is no shortage of rankings available. However, when making your decision on which state to consider teaching in, it is important to consider more than just the listed rankings.
Average teacher salary is an important factor to consider when evaluating where you want to start your career or make a transition.
Additionally, it is important to research the job market within your chosen area when you are looking for the best states for teachers. Do employers generally offer benefits such as retirement plans, health insurance, good teacher salary, and other incentives? Are there opportunities for advancement if you are an elementary teacher?
In this Best States for Teachers ranking, the data set considers a depth of topics across 41 relevant metrics across 5 key dimensions: Career Accessibility, Salary & Compensation, Work Benefits, Work Environment, and Student Performance.
Read on to know more about what we uncovered, the methodology through which we came to our findings, and additional insights that might surprise you.
Let’s find out which are the Best States for Teachers!
Best States for Teachers 2023
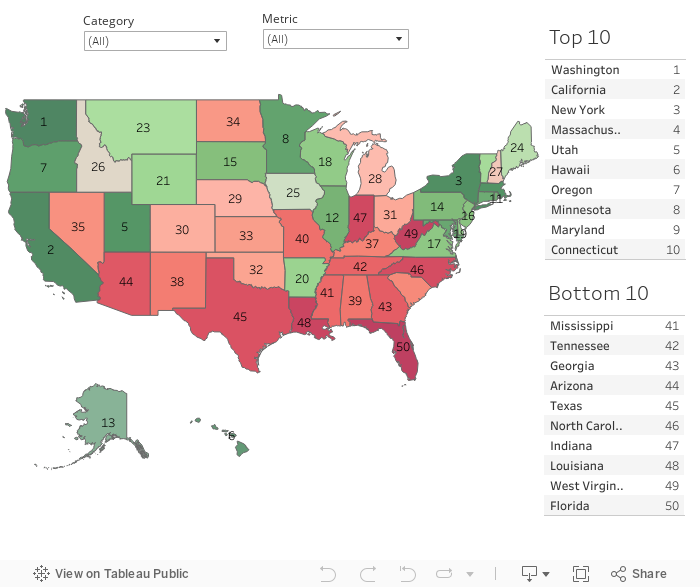
#1 Washington

Average teacher salary: $81,586
Teacher/Student ratio: 8.15
Average teacher pension: $28,204
Job Availability: 4
Washington State stands out in the categories of Salary and Compensation and Work Benefits in the Best States for Teachers 2023. In the first category mentioned, it has the highest salary increase for teachers in the last 10 years. In addition, more than half of its teachers qualify for a pension.
#2 California

Average teacher salary: $87,275
Teacher/Student ratio: 7.48
Average teacher pension: $49,267
Job Availability: 3.60
Sunny California has one of the highest per-pupil spending growth rates in the last 10 years. It also has a low student/teacher ratio, which is important for the education of young people. Another advantage is that teachers only need two years of teaching to achieve tenure.
#3 New York

Average teacher salary: $92,222
Teacher/Student ratio: 10.73
Average teacher pension: $43,432
Job Availability: 5.25
The Big Apple is the state with the highest average teacher salary, in addition to being one of the states with the lowest teacher turnover, only 4.5%. At $25,519.00, it is one of the states with the highest per-pupil spending. It is one of the states with the smallest difference in teacher salaries with other careers.
#4 Massachusetts

Average teacher salary: $88,903
Teacher/Student ratio: 10.76
Average teacher pension: $43,642
Job Availability: 5.06
Massachusetts ranks in the top 3 in the Salary & Compensations category due to its competitive salaries for both regular and teachers’ starting salaries. The good performance of teachers places the state in second place in the Student Performance category.
#5 Utah

Average teacher salary: $58,619
Teacher/Student ratio: 9.02
Average teacher pension: $17,894
Job Availability: 4.32
Teachers in Utah have a New Teacher Mentoring Program, a Bonus for National Board Certification, and a Public School Enrollment Growth of 12.79%. In addition, it is ranked number two with the highest growth in a 10-year change in salaries, 5.06.
#6 Hawaii

Average teacher salary: $67,000
Teacher/Student ratio: 7.81
Average teacher pension: $30,708
Job Availability: 3.43
Hawaii is the number 1 state in teacher diversity with 74%, number 3 in our average starting salaries metric, as well as one of the states with the lowest percentage of the employer contribution rate in the Best States for Teachers ranking.
#7 Oregon

Average teacher salary: $69,671
Teacher/Student ratio: 7.09
Average teacher pension: $37,794
Job Availability: 3.58
Our number 1 in the Work Benefits category, standing out in the metrics as number 1 also in Teacher Contribution Rate with 0.04 and a 1.1 in Employer Contribution Rate in position number 2. One of the advantages for these teachers is also the Teacher /Student ratio of 7.09, one of the lowest in the country.
#8 Minnesota

Average teacher salary: $68,491
Teacher/Student ratio: 9.41
Average teacher pension: $27,593
Job Availability: 4.46
This state does not have a GPA Requirement for Admission into Prep Programs but encourages diversity teacher encouragement. Likewise, 81% of teachers comment that they have Classroom Autonomy. In addition, it has a 0.74 employer contribution rate.
#9 Maryland

Average teacher salary: $75,766
Teacher/Student ratio: 10.06
Average teacher pension: $24,409
Job Availability: 5.44
The State of Maryland requires teachers to have an Individual GPA 3 or +, plus gives you a Bonus for National Board Certification. On the other hand, it fosters diversity teacher encouragement.
#10 Connecticut

Average teacher salary: $81,185
Teacher/Student ratio: 11.56
Average teacher pension: $53,452
Job Availability: 6.00
The Constitution State ranks in the top 5 for highest average salaries, as well as ranks #2 for average teacher pension. In addition, it is the state with the highest growth per pupil spending in the last 10 years.
FAQs
How much do teachers make in Florida?
The teacher’s average salary in Florida is $51,230 per year.
Which state pays teachers the least?
Mississippi has the lowest teacher salary in the country at $47,162.
Starting teacher salary: Which state has the highest?
New Jersey has the highest starting teacher salary in the U.S. at $54,053.
California high school graduation rate: Do you know it?
The high school graduation rate in California this year is 84.20%, the lowest in the country.
Methodology
In order to determine the best and worst states to be a teacher, Scholaroo compared the 50 states across five key dimensions:
1. Career Accessibility
2. Salary & Compensation
3. Work Benefits
4. Work Environment
5. Student Performance
We evaluated those dimensions using 41 relevant metrics, which are listed below with their corresponding weight. Each metric was graded on a 100-point scale, with a score of 100 being the max.
Finally, we determined each state’s weighted average across all metrics to calculate its overall score and used the resulting scores to rank-order our sample.
Career Accessibility
New Teacher Mentoring Program: Half Weight (1.50 points)
Note: This binary metric considers if the state requires induction and mentoring for teachers.
Performance Assessment Requirement: Half Weight (1.50 points)
Note: This metric considers if the state requires a performance assessment for new teachers.
Location Quotient: Regular Weight (3.00 points)
Note: This metric measures the concentration of jobs for postsecondary teachers.
Public School Enrollment Growth: Regular Weight (3.00 points)
Note: This metric measures the percentage growth in 10 years of public school enrollment.
Basic Skill Test Requirement for New Teachers: Half Weight (1.50 points)
Note: This metric considers if the state requires a basic skill test for admission into teacher prep programs.
GPA Requirement for Admission into Prep Programs: Half Weight (1.50 points)
Note: This metric considers if the state requires GPA and its minimum for admission into teacher prep programs.
Job Availability: Regular Weight (3.00 points)
Note: This metric measures the teacher availability for teachers per capita.
Teacher Compensation
Average Salaries: Double Weight (7.14 points)
Note: This metric measures the average teacher salary.
Average Starting Salaries: Double Weight (7.14 points)
Note: This metric measures the average teacher salary per state.
Bonus for National Board Certification: Half Weight (1.92 points)
Note: This binary metric considers if the state provides additional pay to teachers who obtain the National Board Certification.
Educator Pay Gap: Regular Weight (3.85 points)
Note: This metric measures the educator pay gap of teachers compared to other professionals with the same education and years of experience.
10-Year Change in Teacher Salaries: Regular Weight (3.85 points)
Note: This metric measures the percentage change of salaries between the 2009 and the 2019 academic years.
Teacher Benefits
Teacher Tenure: Half Weight (1.56 points)
Note: This metric measures the length of time before a teacher earns tenure.
Teacher Retirement Ratings: Double Weight (6.25 points)
Note: This metric measures the retirement plan ratings by Bellwether Education Partners.
Average Teacher Pension: Regular Weight (3.13 points)
Note: This metric measures the average teacher pension adjusted to the cost of living.
Teachers that qualify for a pension: Regular Weight (3.13 points)
Note: This metric measures the percentage of teachers who qualify for a pension.
Social Security Participation: Half Weight (1.56 points)
Note: This binary metric considers if the state provides Social Security to retired teachers.
Portable Retirement Option: Half Weight (1.56 points)
Note: This binary metric considers if teachers have the ability to retain undiminished rights to retirement benefits when switching employers.
Teacher Contribution Rate: Regular Weight (3.13 points)
Note: This metric measures the percentage of teachers’ salaries that goes into the pension fund annually.
Employer Contribution Rate: Regular Weight (3.13 points)
Note: This metric measures the percentage of what the state, school district, or both pay annually to the pension fund.
Vesting Period: Half Weight (1.56 points)
Note: This metric measures the number of years before a teacher becomes eligible to receive a pension.
Work Environment
Teacher Diversity: Regular Weight (2.17 points)
Note: This metric measures the percentage of teachers of color per state.
Diversity Teacher Encouragement: Half Weight (1.09 points)
Note: This binary metric considers the presence of prep programs to encourage diverse candidates into teacher preparation programs.
Planned Teacher Turnover: Regular Weight (2.17 points)
Note: This metric measures the percentage of teachers who plan to leave teaching.
Teacher/Student Ratio: Regular Weight (2.17 points)
Note: This metric measures the teacher/student ratios in public elementary and secondary schools.
Per-Pupil Spending Growth: Regular Weight (2.17 points)
Note: This metric measures the percentage change of annual per-pupil spending (Public Elementary-Secondary System Finances) in 10 years.
Per-pupil spending: Regular Weight (2.17 points)
Note: This metric measures the annual per-pupil spending in Public Elementary-Secondary School System Finances.
Student Behavior: Regular Weight (2.17 points)
Note: This metric measures bullying rates + the number of physical attacks (without a weapon) + weapon carrying rates.
Teachers with 5- years of Experience: Regular Weight (2.17 points)
Note: This metric measures the percentage of teachers with 5 or less years of experience.
Teachers with 20+ years of Experience
Note: This metric measures the percentage of teachers with 20 or more years of experience.
Administrative Support: Regular Weight (2.17 points)
Note: This metric measures the percentage of teachers who find their school administration’s behavior toward staff is supportive and encouraging.
Classroom Autonomy: Half Weight (1.09 points)
Note: This metric measures the percentage of teachers who report having control in their classroom in areas of planning and teaching.
Collegiality Within School: Regular Weight (2.17 points)
Note: This metric measures the percentage of teachers who agree they worry about the security of their job because of the performance of their students or school.
Testing-Related Job Insecurity: Regular Weight (2.17 points)
Note: This metric measures the percentage of teachers who find their school administration’s behavior toward staff is supportive and encouraging.
Student Performance
High School Graduation Rate: Regular Weight (1.43 points)
Note: This metric measures the percentage of Public High School 4-year adjusted cohort graduation rate.
High School Dropout Rate: Regular Weight (1.43 points)
Note: This metric measures the percentage of high school dropouts among persons 16 to 24 years old (status dropout rate).
SAT Scores: Regular Weight (1.43 points)
Note: This metric measures the SAT mean scores of High School Seniors.
ACT Scores: Regular Weight (1.43 points)
Note: This metric measures the average ACT score (Composite score: English, Mathematics, Reading, Science scores) of Graduates.
Reading Test Scores: Regular Weight (1.43 points)
Note: This metric measures the Average Scale Scores between 4th and 8th Grade Reading scores.
Math Test Scores: Regular Weight (1.43 points)
Note: This metric measures the Average Scale Scores between 4th and 8th Grade Mathematics scores.
Student Safety: Regular Weight (1.43 points)
Note: This metric is based on the Student Safety ranking of Scholaroo’s “Best & Worst School Systems”.


