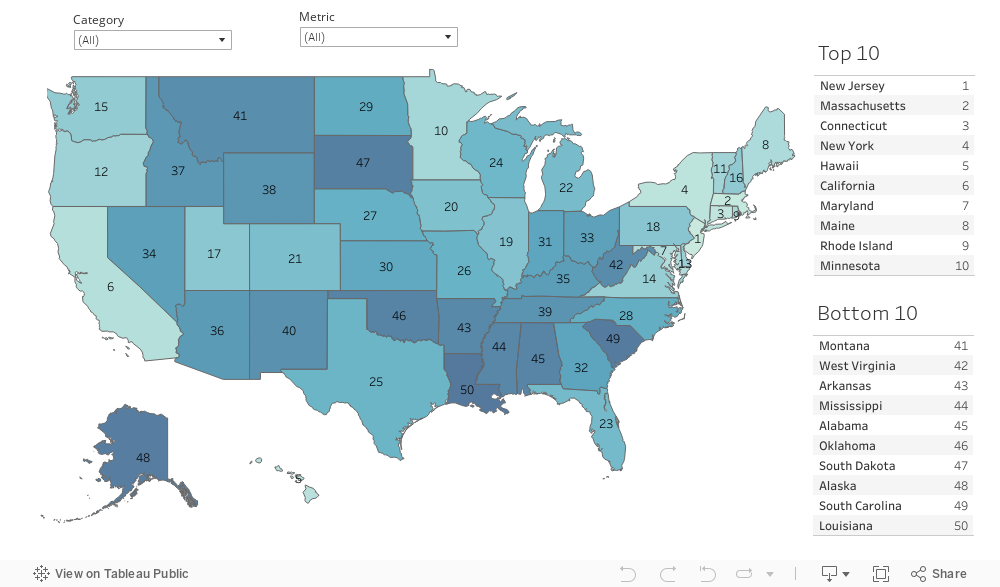
Rankings of Best & Worst States for Gen Z
There are at least three facts about the powerful generation of Gen z that was born from 1997 to 2012. The first is that Gen Z thrives politically and advocates for a variety of causes. The second is that this generation is conscious about their consumption and has ethical solid convictions. The third is that Gen Z boasts of leaders and influencers of the digital era. The people of Gen Z are known as the digital natives as, since early childhood, they have been exposed to the internet and the digital world. This generation is also much more diverse both ethnically and racially and is considered more progressive due to the cultural exposure they have.
Naturally, this generation, now aged 10 to 25, is quite unique compared to the generations preceding them. This makes their decision on where to live more challenging because Gen Z has more distinct needs than someone born in Gen X. For example, Gen Z is known to be more concerned about mental health issues, green policies, and social/political factors than people born in the generations before them.
This unique report considers a depth of topics across 42 metrics in 6 key dimensions: Education, Health, Social & Political Environment, Quality of Life, Green Policies, and Safety. The statistics provided here will help you understand where this generation of digital natives would thrive, and where they would struggle.
Category Breakdown

Methodology
In order to determine the best and worst states for Gen Z, Scholaroo compared the 50 states across six key dimensions:
- Education
- Health
- Social & Political Environment
- Quality of Life
- Green Policies
- Safety
We evaluated those dimensions using 42 relevant metrics listed below with their corresponding weight. Each metric was graded on a 100-point scale, with a score of 100 being the max.
Finally, we determined each state’s weighted average across all metrics to calculate its overall score and used the resulting scores to rank-order our sample.
Education (20 points)
Best School System: Double Weight (4.21 points)
Note: Based on Scholaroo’s Student Success Ranking.
College-Going Rate: Double Weight (4.21 points)
Note: Percentage of High School Graduates going directly to College.
High School Graduation Rate: Double Weight (4.21 points)
Note: Percentage of Public High School 4-year adjusted cohort graduation rate (ACGR).
Pupil/Teacher Ratio: Regular Weight (2.11 points)
Note: Average pupil/teacher ratios in public elementary and secondary schools.
Annual Per-Pupil Spending: Regular Weight (2.11 points)
Note: Average annual per-pupil spending in Public Elementary and Secondary Schools.
Share of Young High School Graduates: Regular Weight (2.11 points)
Note: Percentage of 18- to 24-year-olds who have completed high school.
Human Capital Investment Rating: Half Weight (1.05 points)
Note: Index measuring the state’s educational attainment, ACT Scores and, Science and Engineering workforce.
Health (20 points)
Depression Rate: Double Weight (2.76 points)
Note: Percentage of 12-17 year-olds that reported suffering from at least one major depressive episode (MDE) in the past year.
Suicide Rate: Double Weight (2.76 points)
Note: Number of deaths by suicide of 15-24 year-olds per 100k.
Tobacco Use Rate: Double Weight (2.76 points)
Note: Percentage of children ages 12-17 who used a tobacco product in the past month.
Alcohol Use Rate: Double Weight (2.76 points)
Note: Percentage of children ages 12-17 who reported drinking alcohol in the past month.
Illicit Drug Use Rate: Double Weight (2.76 points)
Note: Percentage of children ages 12-17 who reported using illicit drugs, including marijuana, in the past month.
Health Education Curriculum: Regular Weight (1.38 points)
Note: Percentage of Secondary Schools that required Health Education Instruction in any of grades 6–12.
Healthy Eating Curriculum: Regular Weight (1.38 points)
Note: Percentage of Secondary Schools in which teachers taught the benefits of healthy eating in a required course during the school year.
Sexual Health Curriculum: Regular Weight (1.38 points)
Note: Percentage of Secondary Schools in which teachers taught all 20 sexual health topics (including STDs, contraceptive methods, and gender expression) in any of grades 9–12.
Obesity Rate: Regular Weight (1.38 points)
Note: Percentage of children ages 10 to 17 who have obesity.
Physical Inactivity Rate: Half Weight (0.69 points)
Note: Percentage of High School students who were not physically active for at least 60 minutes per day on 5 days or more.
Social & Political Environment (20 points)
LGBTQ+ Friendliness: Double Weight (5.33 points)
Note: Based on Outleadership’s State LGBTQ+ Business Climate Index (Legal and Nondiscrimination Protections, Youth and Family Support, Political and Religious Attitudes, Health Access and Safety, Work Environment and Employment).
Gender Equality: Double Weight (5.33 points)
Note: Based on Wise Voter’s Best & Worst States for Women.
Racial Disparity Rank: Double Weight (5.33 points)
Note: Based on Scorecard’s Racial Disparity rank on the gap in outcomes between white residents and residents of color that result from economic exclusion and structural inequity.
Volunteering Rate: Regular Weight (2.67 points)
Note: Rate of total volunteers in 2022.
Right to Protest: Half Weight (1.33 points)
Note: Number of enacted laws that restrict the right to peaceful assembly.
Quality of Life (15 points)
Gen Z Population Rate: Double Weight (3.33 points)
Note: Percentage of the population that belongs to Gen Z.
Share of Parks: Double Weight (3.33 points)
Note: Percentage of the state covered in parks.
Air Pollution: Regular Weight (1.67 points)
Note: Average exposure of the general public to particulate matter of 2.5 microns or less measured in micrograms per cubic meter.
Bicycle Friendly State Ranking: Regular Weight (1.67 points)
Note: Bicycle Friendly State Bike League ranking based on Infrastructure & Funding, Education & Encouragement, Traffic Laws & Practices, Policies & Programs, and Evaluation & Planning.
Share of Movie Theaters: Regular Weight (1.67 points)
Note: Number of movie theaters, per capita.
Share of Museums: Regular Weight (1.67 points)
Note: Number of museums, per capita.
Share of Bars: Regular Weight (1.67 points)
Note: Number of bars, per capita.
Green Policies (15 points)
Clean Energy Policies: Double Weight (3.75 points)
Note: Number of renewable energy policies and incentives.
CO2 Reduction Target: Regular Weight (1.67 points)
Note: Government-initiated target to reduce greenhouse gas emissions.
Aluminum Cans Recycling: Regular Weight (1.88 points)
Note: Percentage of recycled aluminum cans.
Packaging Material Recycling: Regular Weight (1.67 points)
Note: Percentage of recycled containers and packaging materials.
PET Bottles Recycling: Regular Weight (1.67 points)
Note: Percentage of recycled pet bottles.
Plastic Recycling: Regular Weight (1.67 points)
Note: Percentage of recycled rigid plastics.
Single-Use Plastic Bag Ban: Regular Weight (1.67 points)
Note: Considers if the state has adopted a law restricting or banning plastics for single use.
Safety (10 points)
School Firearm Possession Rate: Double Weight (2.22 points)
Note: Number of renewable energy policies and incentives.
Sexual Violence Rate: Double Weight (2.22 points)
Note: Percentage of High School students who experienced sexual violence.
Bullying and Sexual Harassment Prevention: Double Weight (2.22 points)
Note: Percentage of secondary schools where all school staff received professional development on preventing, identifying, and responding to student bullying and sexual harassment.
School Bullying Rate: Regular Weight (1.11 points)
Note: Percentage of High School students bullied on school property.
Cyber Bullying Rate: Regular Weight (1.11 points)
Note: Percentage of High School students electronically bullied through texting, Instagram, Facebook, or other social media.
State Anti-Bullying Laws & Policies: Regular Weight (1.11 points)
Note: Number of components for State Anti-Bullying Laws and Regulations (including reporting and investigations, safeguards and supports, review and update of local policies, prevention education, parent engagement, and others).